


 Governance and Policy Management
KRIs vs KPIs: Which Ones Belong in Your Risk Report

NHI Management Group argues that many cyber “KRIs” reaching boards are really activity counts that rise and fall regardless of risk, so directors hear nothing until an incident forces the conversation. The fix starts with knowing which measures answer which question. Complyan’s executive and board reporting presents risk to leadership, and this piece sets the rule for what belongs in that report: when to use a key risk indicator, when a key performance indicator, and how to anchor each.
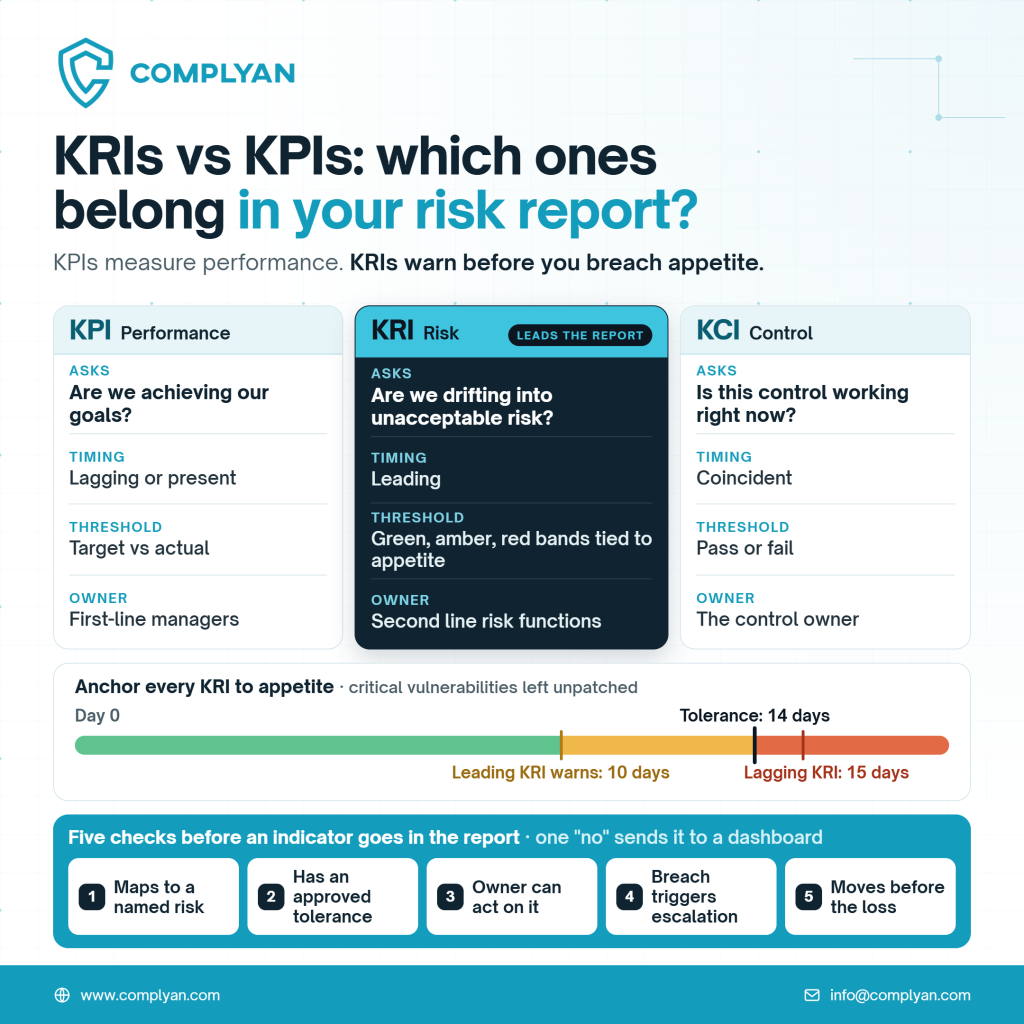
The Difference at a Glance
KPI | KRI | KCI | |
|---|---|---|---|
Question | Are we achieving our goals? | Are we drifting into unacceptable risk? | Is this control working right now? |
Timing | Lagging or present | Leading | Coincident |
Threshold logic | Target against actual | Green, amber, and red bands tied to risk appetite | Pass or fail |
Typical owner | First-line managers | Second line or shared risk functions | The control owner |
Typical audience | Management and operators | Executives, risk owners, and boards | Control owners |
The questions come from Secureframe, and the timing, threshold, and ownership rows from ShieldIQ and RiskHub. A key control indicator, or KCI, bridges the two: it reports in real time whether a control is functioning.
The Same Number Can Be Either
Context and thresholds decide the label, per Cybersaint. CFlow’s example is system uptime: it is a KPI for IT performance and also a KRI for operational resilience. If it is judged against a target, it is a KPI. If it is judged against a tolerance that triggers escalation, it is a KRI.
What Belongs in a Risk Report
Lead with KRIs: the report exists to show where exposure is moving. NHI Management Group’s test is that a KRI needs a tolerance to measure against, and without one it is just a metric. With one, it has thresholds, an owner, and an escalation route.
Add KPIs for context: a KPI explains whether the process behind a risk is performing, so a rising KRI can be read alongside it.
Add KCIs for the few controls that matter most: a failing key control deserves its own line.
Keep the list short: Cybersaint suggests starting with three to five KRIs tied to key risks, and RiskHub argues that twenty well-chosen, appetite-anchored indicators that a committee acts on beat six hundred in a data lake.
Anchor Every KRI to Risk Appetite
Venvera explains that a KRI threshold, such as the green-to-amber boundary, is how a qualitative appetite statement becomes operational. NHI Management Group gives a notional example from NIST: a leading KRI of critical vulnerabilities unpatched at 10 days, against a tolerance of 14 days, with a lagging KRI at 15 days. The leading one warns, and the lagging one proves tolerance was breached.
Regional supervisors place appetite with the Board. Under the CBUAE Operational Risk Management Regulation, the Board itself must approve and review operational risk appetite and tolerance at least annually, so thresholds set by the security team alone are opinions, as NHI Management Group puts it.
Two further checks help. ShieldIQ advises back-testing KRI bands against past incidents before rollout. RiskHub warns that thresholds set too tight cause alert fatigue.
Five Questions Before an Indicator Goes in the Report
This list is practical guidance. Does it map to a named risk? Does it have an approved tolerance? Can its owner act on it? Does crossing the threshold trigger escalation? Does it move before the loss instead of after? A “no” to any of these means the measure belongs on an operational dashboard, where a team uses it daily, and not in a report the board reads each quarter.
Match Cadence to the Audience
UINAT suggests tuning cadence by audience: quarterly for the board, monthly for the CISO, and daily or weekly for the SOC. The same data can feed all three, but the board page should show only the indicators that crossed or neared a tolerance, with the trend and the decision needed.
Pair KRIs With KPIs
Risk | KRI (leading) | Related KPI |
|---|---|---|
Critical service outage | Critical patches overdue, failed backups, per Symbiant | Service availability, per Symbiant |
Supplier failure | Share of vendors with overdue risk assessments, per Cybersaint | Vendor assessments completed per quarter, per Cybersaint |
Vulnerability exposure | Critical flaws unpatched at 10 days against a 14-day tolerance | Mean time to remediate (practical guidance) |
Cybersaint explains the logic: when the KRI trends up, leadership checks whether the paired KPI shows a resource or process bottleneck behind the exposure.
A Sample Report Page
This page is illustrative. The 10-day and 14-day values follow NIST’s notional example, and the other figures are invented.
Risk | KRI | Tolerance | Current | Status | Owner and escalation |
|---|---|---|---|---|---|
Slow vulnerability remediation | Critical flaws unpatched at 10 days | 14-day limit | 6 items at 10 days | Amber | Head of Infrastructure, weekly review |
Recovery failure | Critical systems with no restore test in 90 days | 0 | 2 | Red | CISO, this week |
Supplier failure | Critical vendors with overdue assessments | 5 percent or less | 12 percent | Red | Risk lead, to the risk committee |
Each row names the risk, the signal, the line that matters, the status, and the person who acts. That is what a board needs to decide.
Who Owns What
ShieldIQ advises keeping KPI ownership with first-line managers and KRI ownership with the second line or shared risk functions. RiskHub adds that the second line designs, challenges, and validates thresholds and escalates independently. A team that sets its own threshold and judges its own result is marking its own homework.
Mistakes to Avoid
Activity counts as KRIs: patches applied and alerts closed move with effort, not risk.
No tolerance behind the indicator: NHI Management Group lists this as a common failure.
Lagging only: RiskHub calls a dashboard of lagging indicators a history book.
Too many indicators: a long list hides the few that need action.
Static thresholds: review bands when appetite, systems, or threats change.
Build the Rhythm in Complyan
This is practical guidance. Hold scored risks and their appetite statements in Complyan’s cyber risk management platform, define each indicator once with its owner in Complyan’s performance and metrics tools, and attach evidence through Complyan’s audit and compliance management platform. Add supplier indicators from Complyan’s third-party risk management, and use Complyan’s cyber maturity assessment to show how control strength shifts over time.
Conclusion
A risk report earns its place when each indicator is tied to a named risk, judged against an approved tolerance, owned by someone who can act, and tracked with a route to escalate. Lead with KRIs, use KPIs and KCIs to explain them, and keep the list short enough that the board can act on every line.